Using a Fishbone or Ishikawa Diagram for Process Improvement
How to Use a Fishbone (Ishikawa) Diagram for Root Cause Analysis
Something’s off.
KPIs are slipping. NPS has taken a nosedive. Morale is at an all-time low.
This is when it’s probably well past time to look past symptoms and identify what’s really going on. One classic tool that can help? The Ishikawa Diagram, also known as the Fishbone Diagram or Cause-and-Effect Diagram.
Originally developed by Kaoru Ishikawa for quality control in the manufacturing world, the Fishbone Diagram has since become a trusted problem-solving tool across industries. Whether you're in CX, ops, tech, or product, it's a helpful way to visualize contributing factors and pinpoint root causes.
What Is a Ishikawa Diagram?
At a high level, a Ishikawa Diagram helps teams:
Clearly define the problem
Categorize potential causes
Brainstorm contributing factors
Dig into each factor using tools like the 5 Whys
Visualize connections and uncover patterns
Think of it as structured brainstorming meets visual mapping.

Steps to Build a Ishikawa Diagram
1. State the Problem Clearly
Start by writing your problem statement at the “head” of the fish. Keep it specific and measurable.
Example: “NPS has dropped by 50 points this quarter.”
2. Define Your Categories
These are the "bones" of the diagram– high-level areas where causes may be hiding. You can start with common categories like:
People
Process
Product
Policy
Planning
Technology
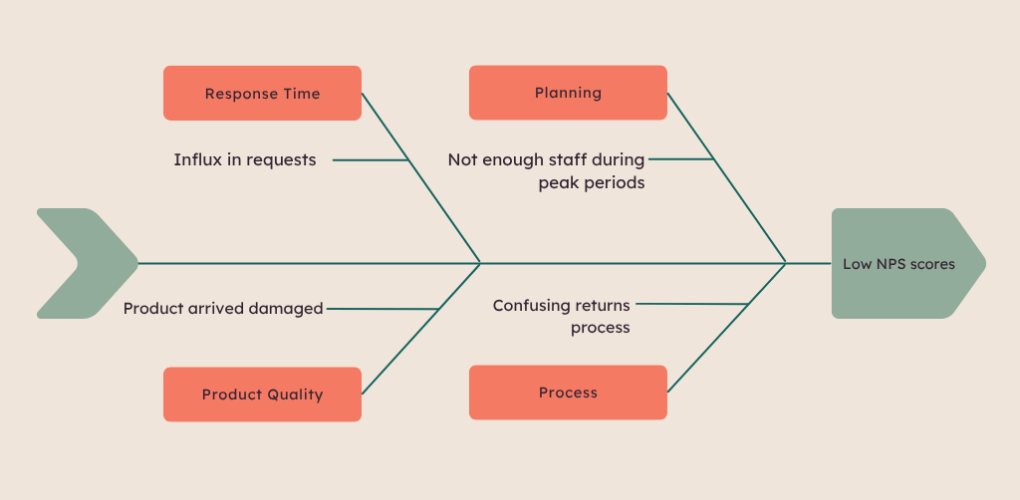
For our CX example, let’s choose:
Response Time
Planning
Process
Product Quality
3. Brainstorm Contributing Factors
For each category, list out specific factors or observations that might be contributing to the problem.
In the "Response Time" category:
Customer service is slow to reply
Customers are unsatisfied with outcomes
Under "Product Quality":
Product arrived broken
Return portal is confusing
4. Use the 5 Whys to Find Root Causes
To move from surface-level symptoms to deeper causes, try the 5 Whys method– asking “Why?” repeatedly to drill down.
Customer service is slow to reply
Why? There's an influx of tickets.
Why? A big sale triggered a wave of returns.
Why? The discounted product arrived broken.
Why? Packages weren’t marked fragile.
Why? The warehouse wasn’t informed of contents.
Repeat this across other categories. You may uncover multiple root causes, or even one root cause appearing in multiple branches.
5. Analyze the Results
Once all potential causes are mapped out, review your diagram for patterns, overlaps, and commonalities. This is where insight emerges. You’re not just listing problems, you’re connecting the dots to determine where to act.
More Process Improvement Resources